Florida State Profile
Every child in Florida deserves healthy environments in which to thrive. This is a snapshot of current children’s environmental health indicators in the state.
Every child in Florida deserves healthy environments in which to thrive. This is a snapshot of current children’s environmental health indicators in the state.
Every child in Delaware deserves healthy environments in which to thrive. This is a snapshot of current children’s environmental health indicators in the state.
Every child in Connecticut deserves healthy environments in which to thrive. This is a snapshot of current children’s environmental health indicators in the state.
Every child in Colorado deserves healthy environments in which to thrive. This is a snapshot of current children’s environmental health indicators in the state.
Every child in Virginia deserves healthy environments in which to thrive. This is a snapshot of current children’s environmental health indicators in the state.
Every child in Pennsylvania deserves healthy environments in which to thrive. This is a snapshot of current children’s environmental health indicators in the state.
Every child in California deserves healthy environments in which to thrive. This is a snapshot of current children’s environmental health indicators in the state.
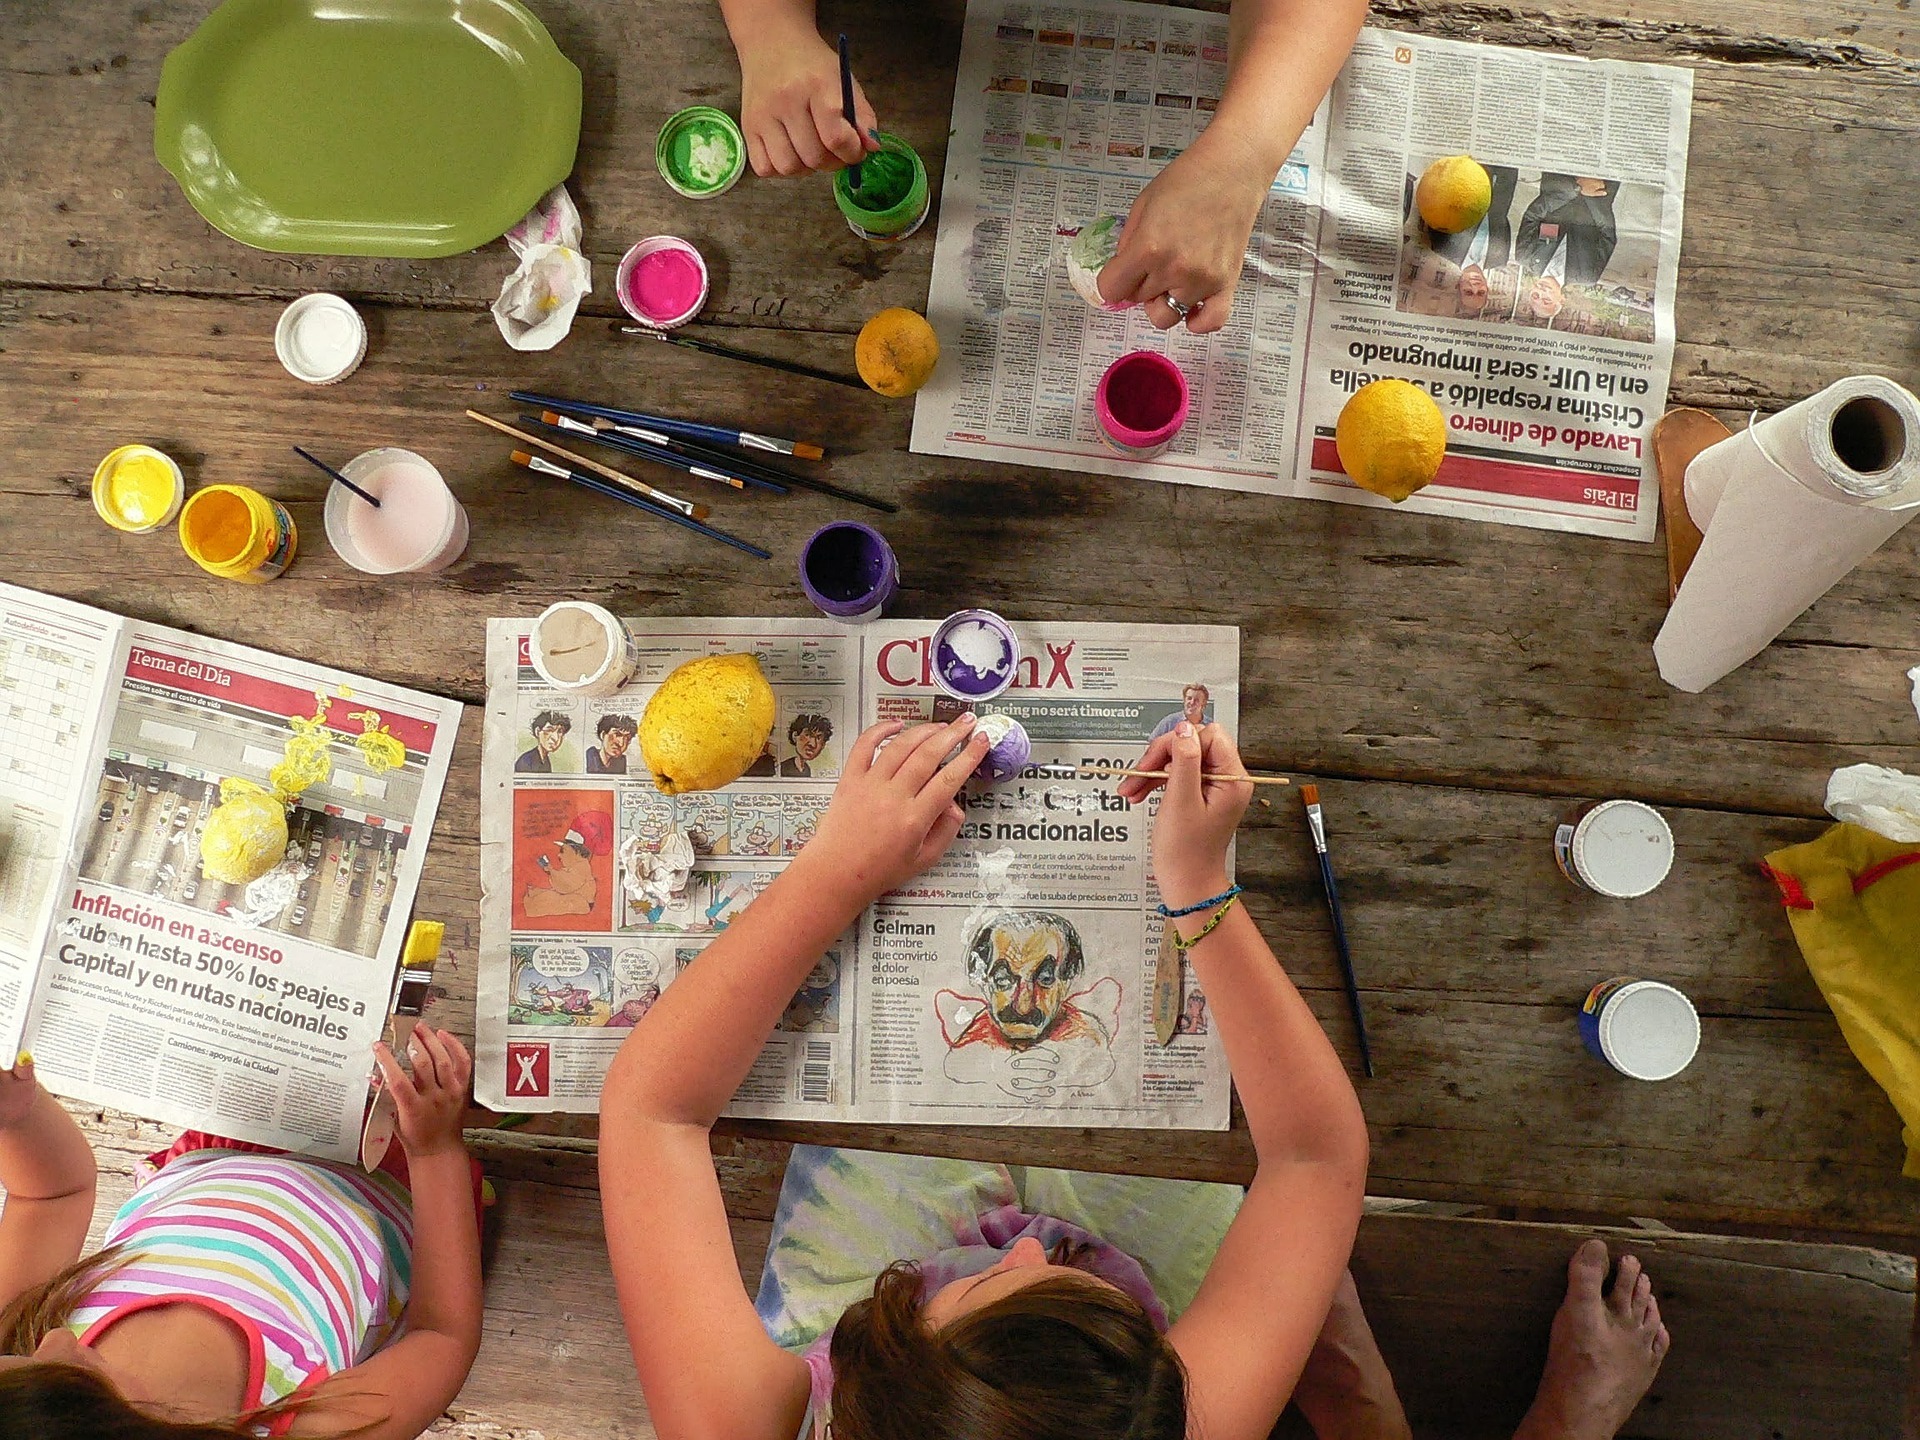
Los materiales de arte y manualidades pueden contener ingredientes tóxicos que, al utilizárseles o guardárseles en una zona de juego, crean un peligro para la salud y el bienestar de los niños.
El arsénico es una sustancia química tóxica que se encuentra presente de forma natural, en las piedras y en el suelo.
La calidad del aire afecta considerablemente la salud de los ninos.