
Florida, the only state in the continental United States with a tropical climate zone, is celebrated for its vast, sunny coastline and diverse wetlands, including the famed Everglades. This unique geography supported a booming citrus industry in the early 20th century, and with the addition of ambitious rail and highway projects, stoked both rapid population growth and an ever-growing tourism sector. The 1971 opening of Walt Disney World Resort defined Orlando as the “Theme Park Capital of the World,” and in 2023, Florida welcomed a record 156.9 million out-of-state visitors.
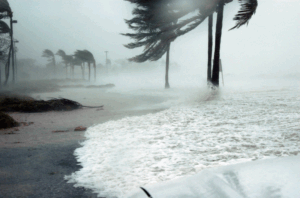
The low-lying peninsula makes the state extraordinarily vulnerable to climate threats, which have become a growing part of life in Florida in recent years. Greening disease and citrus canker have crippled the citrus industry, while major hurricanes in 2017, 2018, 2022, 2023, and 2024 continued to batter the agricultural industry generally. Rising seas and the growing risks of flooding storms have helped push home insurance premiums to the highest in the country, with some major insurers exiting the state entirely.
Toxic algal blooms, fueled by sewage spills and fertilizer runoff, all contribute to water quality and pollution concerns for Floridians, with children being particularly vulnerable. The state’s environmental policy has focused on PFAS contamination in water and soil, including the 2022 passage of HB 1475 which requires the Department of Environmental Protection to adopt statewide rules for cleanup target levels in soil and groundwater by particular dates as well as HB 5001, an appropriations bill with nearly $30 million for testing and remediation for PFAS.
In the profile below, you’ll find a set of key children’s environmental health indicators that illuminate Florida’s environmental risks, children’s exposures, and emerging trends in child health and development.
Safe Drinking Water:
36% of public water utilities had drinking water violations in 2023.
National average: 27.6%
Air Quality:
10.88% of children under age 18 live in counties with unhealthy levels of air pollution. Air quality was monitored in 35 out of 67 counties in Florida in 2024.
Nationwide: 39.88% of children

Warming Temperatures:
3.6 degrees F warmer in 2024 than in 1970.
National average 3.9 degrees F warmer

Toxic Chemical Releases:
41.6 million pounds of toxic chemicals were disposed of or released in 2023.
United States 3.3 billion pounds
Asthma:
13.9% of children under age 18 have asthma (2022-2023).
Nationwide: 6.6%

Pediatric Cancer:
199.5 cases of pediatric cancer per 1 million population (2021).
Nationwide: 179 cases per 1 million
Blood Lead Levels:
2.89% of tested children under age 6 have elevated blood lead levels (2024).
Nationwide: 1.3% (2021)

Neurodevelopmental Disorders:
7.2% of children age 3-17 have ADHD (2022-2023).
Nationwide: 10.5%
5.7% of children age 3-17 have Autism Spectrum Disorder (2022-2023).
Nationwide: 3.9%
Climate change is one of the greatest threats to public health and the safety of future generations. State and local governments are increasingly leading the way and taking urgent climate action into their own hands. From sea-level rise and loss of critical coastline to increased extreme heat days and severe weather events, Florida shoulders significant risks from climate change. Miami is one of the most at-risk major cities in the world to the damages from coastal flooding and storms and has long recognized the existential threat climate change poses to its future.
For over ten years, Miami-Dade County has partnered with Broward, Monroe, and Palm Beach counties to collaborate on climate-related issues. This Southeast Florida Regional Climate Change Compact releases a Regional Climate Action plan every five years, but most recently, in 2020, Miami released its own climate strategy: Miami Forever Climate Ready. The strategy will reduce the increasing risks of flood, heat, and storm impacts over the next 40 years.
The City of Miami formed its strategy through comprehensive collaboration, engaging experts, residents, business owners, nonprofits, universities, and other key stakeholders through workshops, surveys, and panels. Climate adaptation and resiliency are among the top priorities, with the investments aimed at protecting residents from future climate conditions, prioritizing critical and highly vulnerable areas and people, and reducing greenhouse gas emissions.
Children’s environmental health indicators (CEHIs) are measures that can be used to assess the magnitude or extent of environmental hazards, environmental exposures, or children’s health outcomes.
Each headline indicator should be a clear, understandable indicator of children’s environmental health, with broad relevance for a range of audiences at the state level – with relevance to the national level.
The indicators as a package should provide a representative picture of children’s health and relation to the environment.
Each indicator should be calculated using an agreed-upon (and published) method and accessible and verifiable data.
Each indicator should be calculated regularly (at least biennially), with a short lag between the end of the period and publication of the data.
The available data needed for the indicator must be sufficiently robust, reliable and valid.
Indicators must be comparable across all or very nearly all 50 U.S. states.
KIDS COUNT Data Book: State Trends in Child Well-Being. The Annie E. Casey Foundation. Accessed April 2025.
In this profile, counties with “unhealthy” levels of air pollution are those receiving a grade of F for ozone pollution, daily particle pollution (PM2.5), or annual particle pollution (PM2.5) in the American Lung Association’s 2024 State of the Air report. According to the report, 467,335 Florida children under age 18 live in counties that received an F for at least one pollutant. This only considers the 35 counties where air quality is monitored (out of 67). Across the US, 39.88% of children under the age of 18 live in counties with unhealthy levels of at least one measure of air pollution. Nationwide, air quality is monitored in 885 counties (out of 3,243 total).
2024 State of the Air Report. American Lung Association. Accessed April 2025.
Children are more vulnerable to the hazards driven by warming temperatures, such as heatwaves, droughts, flooding, and many other cascading effects. Climate change causes an increase in the frequency and severity of temperature anomalies, extreme weather, and natural disasters globally.
EPA’s Toxics Release Inventory (TRI) tracks the management of certain toxic chemicals
that may threaten human health and the environment. Industrial facilities across the
U.S. are required to annually report the amount of each chemical disposed of or
released into the environment, both on- and off-site. Many of these chemicals are
known carcinogens, developmental toxicants, and neurotoxicants that adversely impact
children’s health, such as arsenic, lead, and mercury.
A wealth of research links exposure to poor outdoor air quality, including high concentrations of ground-level ozone, with the exacerbation of children’s respiratory illnesses, including asthma. Several studies link it with the onset of childhood asthma.
2022-2023 National Survey of Children’s Health. Title V Maternal and Child Health Services Block Grant National Performance and Outcome Measures. Prevalence of current asthma, age 0-17 years. Data Resource Center for Child and Adolescent Health. Maternal and Child Health Bureau, Health Resources and Services Administration. Accessed April 2025.
Although cancer in children is rare, the rate of pediatric cancer has been increasing since the 1970s. It is the leading disease-related cause of death past infancy in U.S. children. Neither genetics nor improved diagnostic techniques can explain the increased rate. According to the 2020 Childhood Cancer Prevention report, no more than 10% of all childhood cancers are derived from heritable genetic risk factors, and hazardous chemicals are a preventable risk factor that contributes to the remaining cases.
In 2023, 11.04% of Florida children under age 6 were tested for blood lead levels (BLLs). Of those tested, 2.89% had a BLL ≥ 3.5 μg/dL. Often the most vulnerable children are not tested, and not all who are tested get reported, so this is likely an underestimate of the true scope of children’s elevated blood lead in Florida. There is no safe level of lead exposure for children. A potent neurotoxicant, lead reduces IQ and impairs other cognitive, behavioral, and developmental functions. In 2021, the CDC lowered the BLL reference value from 5 to 3.5 μg/dL, but much of the available data still categorizes “elevated” BLLs as being 5 ug/dL or higher.
Florida Department of Public Health (via email request) April 2025.
Assessing Child Lead Poisoning Case Ascertainment in the US, 1999–2010. Eric M. Roberts, Daniel Madrigal, Jhaqueline Valle, Galatea King and Linda Kite. Pediatrics April 2017, e20164266; DOI: https://doi.org/10.1542/peds.2016-4266.
Mounting scientific research links environmental exposures with risk of Attention-Deficit Hyperactivity Disorder (ADHD) and Autism Spectrum Disorder (ASD). Neither genetics nor changing diagnoses or other artifacts fully account for the increased incidences of these conditions. ADHD and ASD data are for children aged 3-17 years in this state.
2022-23 National Survey of Children’s Health. Title V Maternal and Child Health Services Block Grant National Performance and Outcome Measures. Prevalence of current ADHD, age 3-17 years; and Prevalence of current Autism or Autism Spectrum Disorder (ASD), age 3-17 years. Data Resource Center for Child and Adolescent Health. Maternal and Child Health Bureau, Health Resources and Services Administration. Accessed April 2025.
NIEHS/EPA Children’s Environmental Health and Disease Prevention Research Centers. 2017 Impact Report
Indicator references often link to sites and data that are not managed by CEHN. Federal websites, especially, may no longer be available. Each time we release an updated factsheet, please be assured that we will also update relevant indicator references to reflect any changes.
All children deserve and need a safe and healthy environment to grow and develop. They need clean air to breathe, safe water to drink, nutritious food to eat, and healthy places in which to live, learn, and play. Early exposure to harmful agents can lead to acute and chronic adverse outcomes. Infants and children are especially vulnerable to environmental exposures because they breathe, eat and drink more, in proportion to their body size, than do adults, and because their bodies and brains are still developing.
A blueprint for Protecting Children’s Environmental Health Network set out to identify a set of CEHIs that can be used to provide an understanding of children’s environmental health at the state level. Through this process, CEHN found that robust, valid, and regularly updated state level data–that are comparable across most states–were not readily accessible. States need adequate funding and capacity to collect and make accessible reliable CEHI data in order to set goals and track progress towards improving children’s health.
Children are our future – society has a moral obligation to protect them. Exposure to environmental hazards can and must be prevented. Prevention requires strong environmental regulations, fully funded and supportive public and environmental health programs and a robust workforce.